How to Use Real-Time Mobile Data to Hedge Against Market Downturns

Mitigate portfolio drawdowns during unexpected market downturns by utilizing real-time mobile data feeds to deploy cross-market hedges. This strategic guide details how to monitor asset correlation matrices, track sudden volume spikes, and execute swift capital rotation between traditional assets and digital tokens via mobile interfaces to neutralize downside risk.
Key Takeaways:
- Downturns occur three times faster than market rallies, making real-time data streaming critical for survival.
- Liquidate vulnerable spot positions or buy inverse derivatives to establish a temporary financial shield.
- Relying on separate platforms causes execution delays; look for cross-asset execution via a single screen.
- Program your mobile notifications to alert you the exact millisecond an asset deviates from its historical variance.
For generations, institutional trading desks held a monopoly over rapid market risk mitigation. When an unexpected economic report dropped, or a geopolitical flashpoint triggered a sharp market sell-off, Wall Street algorithms reacted in microseconds.
Retail investors, meanwhile, are dependent on lagging evening news cycles or clunky desktop software. Therefore, they could only watch as their hard-earned equity evaporated.
The financial landscape has completely flattened. High-frequency cellular infrastructure and cloud-native application delivery allow retail quants to stream institutional-grade order books, live pricing feeds, and macroeconomic data points directly into their pockets.
During market stress, this real-time data is not merely educational; it is a defensive weapon. By learning how to interpret real-time data indicators on your mobile layout, you can actively hedge your exposure, protect your principal capital, and turn market corrections into profitable opportunities.
The Velocity of Bears: Why Real-Time Data Matters
In financial markets, panic is a far more powerful catalyst than greed. Historically, market downturns manifest with staggering velocity, manifesting as a bear cycle. This is different from the deliberately paced and gradual bull cycle.
So, how exactly does a Bear cycle differ from a Bull cycle? Here is a glance at the two market cycle tendencies:
| Feature | Bull Market Cycle | Bear Market Cycle |
| Market Trend | Consistently rising asset prices. | Broadly declining asset prices. |
| Official Definition | No strict rule, but typically marked by an increase of 20% or more from recent lows. | A decline of 20% or more from recent market peaks. |
| Investor Sentiment | Optimistic, confident, and willing to take on financial risk. | Pessimistic, fearful, and risk-averse. |
| Duration | Often spanning several years. | Tend to be shorter, lasting an average of 9 to 19 months. |
Table 1: Bull vs. Bear Market Cycle
Since, during a bear cycle, markets fall faster than they rise, delayed and historic data can often lead to catastrophic failures. However, real-time data allows you to spot structural changes as they happen.
Whether it is a sudden spike in the Cboe Volatility Index (VIX) or a massive wall of sell orders hitting a major equity index, tracking live data lets you pivot before the broader retail public starts to panic-sell.
The Cross-Asset Hedging Playbook
True portfolio defense requires lookahead mechanics: moving capital away from vulnerable assets and into uncorrelated or inversely correlated safe havens. Thanks to modern software design, this rotation no longer requires multi-day processing times.
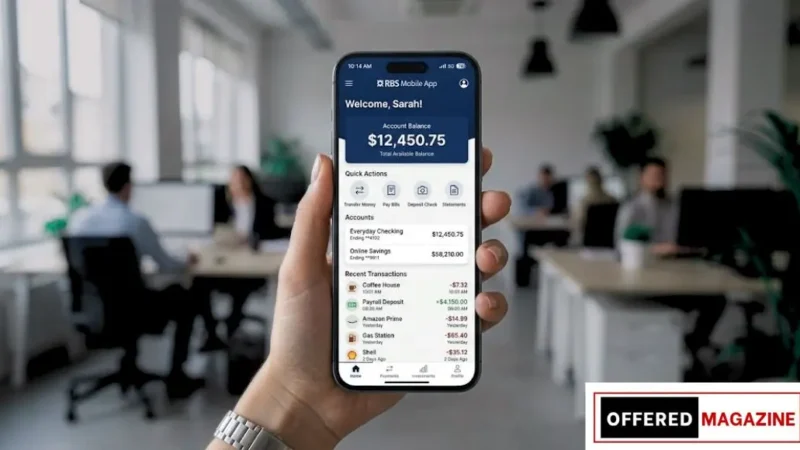
For instance, an active investor tracking an unexpected correction in tech stocks can monitor data directly inside their primary investment app. If technical indicators confirm a structural breakdown, they can instantly exit those positions or purchase protective put options to establish a hard floor under their capital.
On that note, here’s a look at the working principles leading to mobile hedging assets and data triggers:
| Target Asset Class | Primary Real-Time Data Trigger | Preferred Defensive Mobile Hedge |
| Blue-Chip Equities | Sharp breakdown below the 50-day moving average | Multi-Asset Index Put Options/Short ETFs |
| Traditional Fiat (FX) | Central bank interest rate adjustments | Rotation into Safe-Haven Currencies (USD, CHF) |
| Speculative Growth | Sudden volume spikes accompanied by negative order flow | Stablecoin Allocation/Cross-Asset Shorting |
Table 2: Mobile Hedging Assets and Data Triggers
Simultaneously, alternative asset ecosystems provide excellent, non-correlated hedging options during traditional market freezes. Operating an agile, native crypto trading app alongside your traditional holdings allows you to monitor decentralized liquidity lines around the clock.
Because digital asset markets operate 24/7, they often act as a leading sentiment indicator for global retail capital. If a weekend macroeconomic crisis occurs while Wall Street is locked tight, an investor can immediately establish a hedge using liquid stablecoins or short derivatives, effectively insulating their broader net worth before the traditional opening bell rings on Monday morning.
Eliminating Logistical Friction to Prevent Slippage
The biggest threat to a successful hedging strategy isn’t bad analysis—it is operational friction. Many retail investors suffer from extreme app fatigue, dividing their wealth across an array of single-market utilities.
Imagine tracking a sudden market downturn. You open one app to analyze the falling chart, close it to open a secondary banking tool to initiate a transfer, and then log into a third interface to buy your hedge. In high-velocity environments, this multi-app fragmentation results in severe execution lag, high transaction fee leaks, and missed entry targets.
To win the battle against volatility drag, your mobile cockpit must be unified. Accessing global stocks, fiat currencies, and digital instruments from a single, low-latency infrastructure eliminates multi-network transfer bottlenecks. This ensures that your defensive orders hit the interbank or decentralized matching engines the exact millisecond you tap your screen.
Your 4-Step Mobile Deficit Protocol
When a market correction hits, remove emotional impulse by following this systematic, data-driven checklist:
- Verify the Velocity:Open your data panel and analyze the volume profile. Is the sell-off a low-volume retail pullback or a high-volume institutional distribution phase?
- Isolate High-Beta Exposure:Navigate to your portfolio view and identify your most volatile, high-beta assets that are highly susceptible to broader index drawdowns.
- Execute the Inverse Trade:Using a unified asset router, execute your targeted hedge (e.g., buying protective indices or stable assets) to neutralize the directional risk.
- Monitor the Variance:Program real-time push alerts at specific resistance levels to signal when market equilibrium has been restored, allowing you to safely unwind your hedge for a profit.
Final Verdict
Market downturns are a natural, healthy component of the global economic cycle. They are only dangerous to investors who lack the data clarity and structural agility to respond in real time. By transforming your mobile device into a sophisticated, cross-asset control panel and mastering the mechanics of inverse correlations, you effectively remove fear from your trading methodology.
Take Control Of Your Financial Infrastructure Today
Audit your active applications, replace fragmented platforms with comprehensive multi-asset systems, and ensure you have access to uncompromised, real-time data streams to protect your capital through every phase of the market cycle.